Novel Data Representations
Does a two-dimensional picture really contain as much information as a thousand words?
What about a four-dimensional hyperimage from a sophisticated sensor? Asking such questions led ThinkTank Maths to re-examine what we mean by information. The word information brings to mind bytes or megabytes — counting the bits that computers use to represent data. In fact, such ideas go back to the work of Claude Shannon in the 1940s, whose key mathematical idea, Shannon entropy, underpins nearly all of the communication technologies we use every day.
However, Shannon’s approach is far from perfect when applied to the challenges faced by modern science. The volume of data created by sensors and instruments like the Large Hadron Collider may be so enormous that most of it actually has to be thrown away — so how should one decide what to keep without analysing everything? Or what should a Mars rover transmit back to Earth during its narrow communication window? To address such questions, it is crucial to measure the interestingness of data rather than just the raw information content.
Although the aim of this work was not to create immediate applications, but exploratory, strictly fundamental research, in the early stages, TTM discovered a new class of curious mathematical objects we named twistlets. They already proved to be useful for capturing the fine detail of curved shapes, and were successfully tested on complex data provided by a large UK technology company.
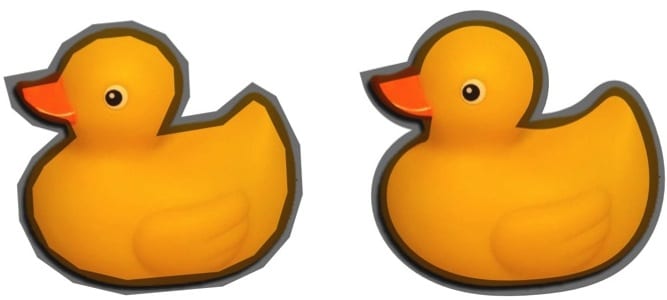
The duck image below shows a twistlet representation on the right: it requires only 13 sample points, compared to 26 points on the left.